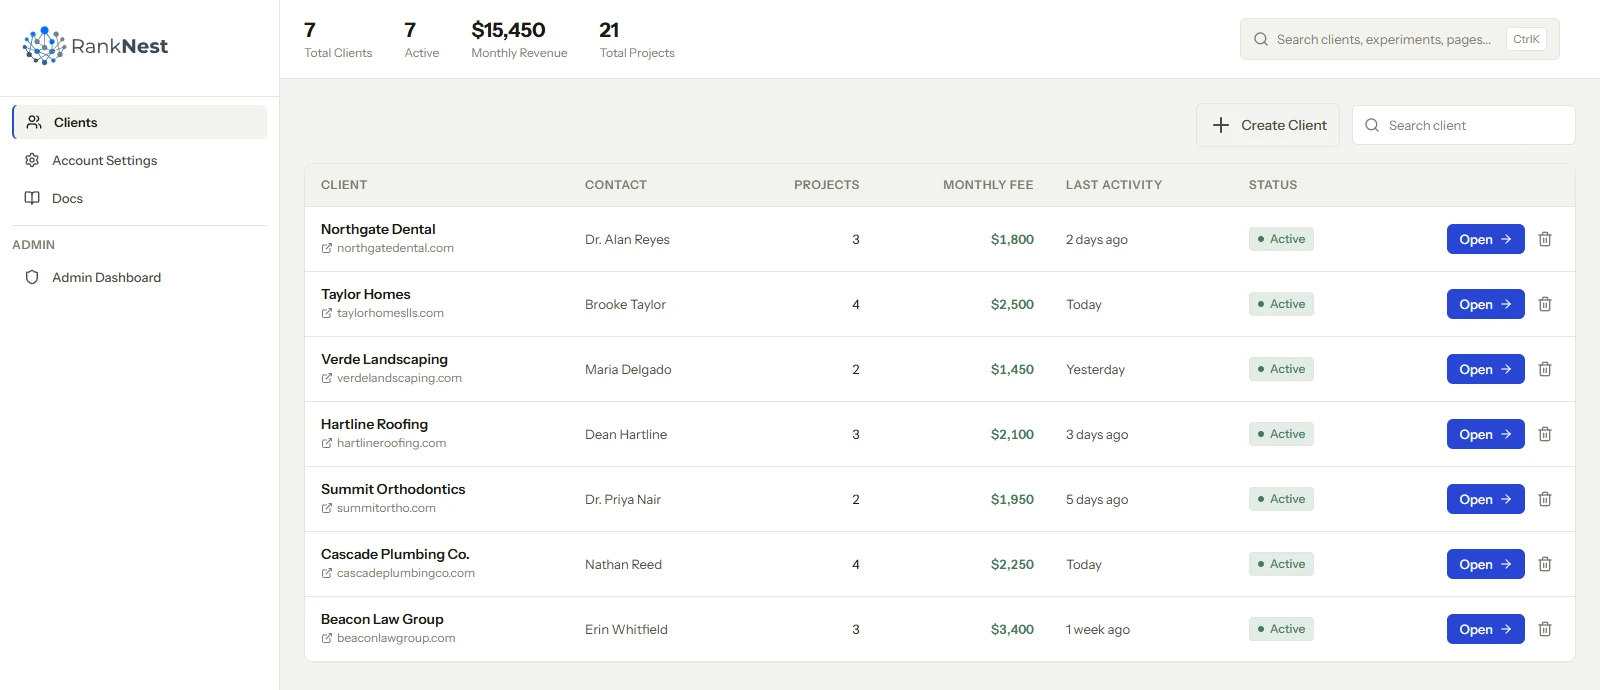

Strong SEO client reporting is a narrative of changes made and measured. The structure has three parts, what we changed, what happened, and what happens next. Each metric in the report ties back to a dated change, so the client reads cause and effect instead of a graph and a shrug.
That distinction decides retainer survival. A dashboard shows that clicks moved. A report has to show why they moved, and an agency that can answer why keeps clients through the flat months, because the work stays visible even when the graph refuses to cooperate.
Why dashboard reporting quietly kills retainers
The reporting tool market sells templates and white-label dashboards, so most agency reports have converged on the same shape. Forty pages of ranking tables, a traffic graph, some channel pie charts, a stock paragraph of commentary. It looks thorough and says almost nothing. We compared the main SEO client dashboards on price and fit elsewhere, and the limit is the same across all of them: a tool that only reads data cannot record work it never saw.
The problem surfaces the first month the graph goes flat or down. A dashboard offers no defense, since it never connected the agency's work to the numbers in the first place. The client looks at a declining line, looks at the invoice, and starts doing subtraction.
Correlation reporting also fails in the good months, in a sneakier way. When traffic rises and the report cannot say which changes drove it, the client has no reason to credit the agency over seasonality or luck. You get no blame in bad months you deserve none of, and no credit in good months you earned.
The three-part report structure
Every monthly report, every client, same shape. What we changed, what happened, what happens next. A report in this structure can run five or six pages and outperform a forty-page dashboard export.
Section 1: What we changed
A dated change log for the month. Title rewrites on which pages, internal link batches with counts, fixes shipped from the audit queue, content published or refreshed. Specific and boring is the goal, this section is the evidence base for every claim in section two.
The discipline that makes this section possible is logging changes when they ship. An agency that dates every change has a causation report half-written by month end. An agency that reconstructs the month from memory writes fiction.
Section 2: What happened
Now pair outcomes to the log. The page whose title changed on the 4th, clicks and position before and after. The target page of an internal link batch, its impressions across the boundary. Where you ran a proper before-and-after test against a GSC baseline, show the delta with its dates.
Two honesty rules keep this section credible. Annotate confounds, algorithm updates, seasonality, a client's site change, in the same breath as the wins. And report the changes that did nothing, because a client who sees you flag your own misses believes your hits.
For metrics with no attached change, one summary page is plenty. Portfolio-level clicks and conversions belong in the report as context. They are the weather, and sections one and two are what you actually did about it.
Section 3: What happens next
Close with the next month's priorities pulled from your audit queue and test results. Ranked, scoped, and connected to the findings that produced them. This section converts the report from a look backward into a standing plan the client is funding.
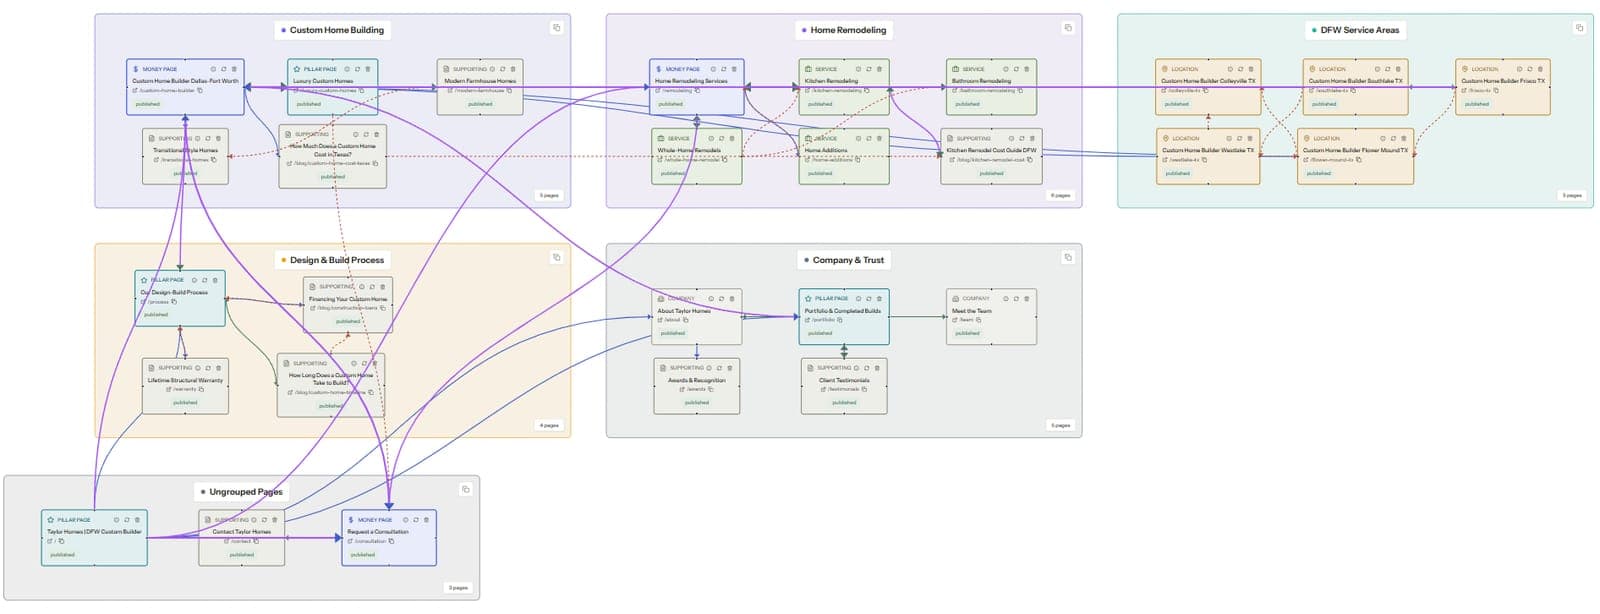
Show your work: link map deltas and test results
The strongest causation exhibits come from the delivery work itself, and two formats consistently land with clients.
The first is the structural before-and-after. If the month's work included internal linking, show the target page's position in the site graph before and after the batch. A page that went from three inbound links at click depth four to eleven links at depth two is a visible, physical change. A client workspace that keeps the site data wired to the right GSC property makes pulling those exhibits routine instead of a screenshot hunt.
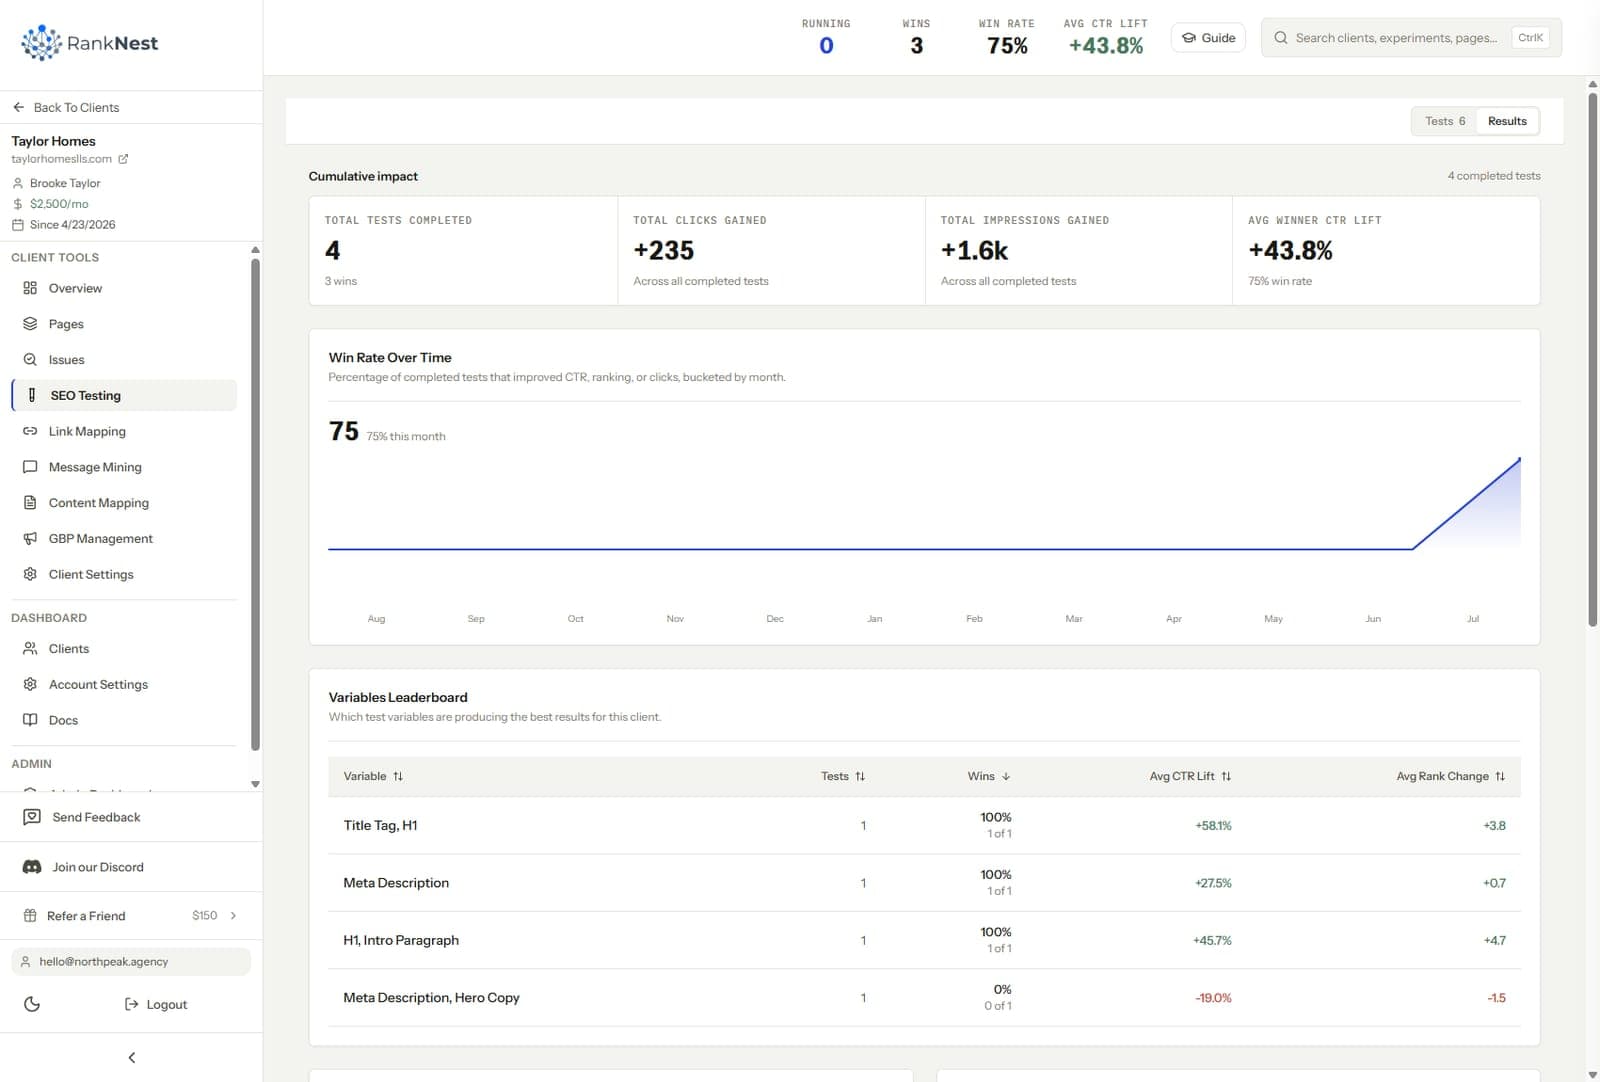
The second is the experiment readout. A change, its baseline window, its after window, the delta. Our guide to SEO testing on client sites covers how to run these properly, and the reporting payoff is that a tested change needs no adjectives. The numbers argue for themselves.
Both exhibits share a property that ranking wallpaper lacks. They survive a skeptical reader, a CFO, or a new marketing director hunting for a reason to consolidate vendors.
A worked example: one month, one client
Here is the structure filled in for an imaginary HVAC client, so the shape is concrete. Names and numbers are illustrative.
Section one lists four dated changes. Rewrote titles on three service pages on the 4th, added an 8-link internal batch pointed at the AC repair page on the 9th, fixed a redirect chain from the old site on the 15th, published one refreshed blog post on the 22nd.
Section two pairs each with its outcome so far. The retitled pages moved from average position 9.1 to 7.4 with clicks up on two of three, the AC repair page's impressions rose after the link batch, the redirect fix has no visible effect yet and says so plainly. One line notes a mid-month core update as a confound on all of it.
Section three lists next month's queue. Two title tests on the furnace pages, an internal link batch for the maintenance-plan page, and the top three items from the quarterly audit. Six pages total, every number attached to a dated action, nothing the client cannot follow.
Reporting anti-patterns that get agencies fired
- Ranking wallpaper, pages of keyword tables no client action could ever follow from
- Vanity stacking, leading with impressions because clicks were flat
- Blaming an algorithm update more than once or twice a year
- Changing which KPIs headline the report from month to month
- Jargon without translation, crawl budget and DOM depth mean nothing to a dentist
- Reports with no requested decision, if nothing needs the client's input, say so in one line
- Sending the report late, a day-15 report reads like an afterthought no matter what is in it
Seven items because there really are seven. Most agencies commit two or three of these for years without connecting them to churn, because the cancellation call cites budget, and budget is what clients say when they cannot see the work.
Where the report content comes from
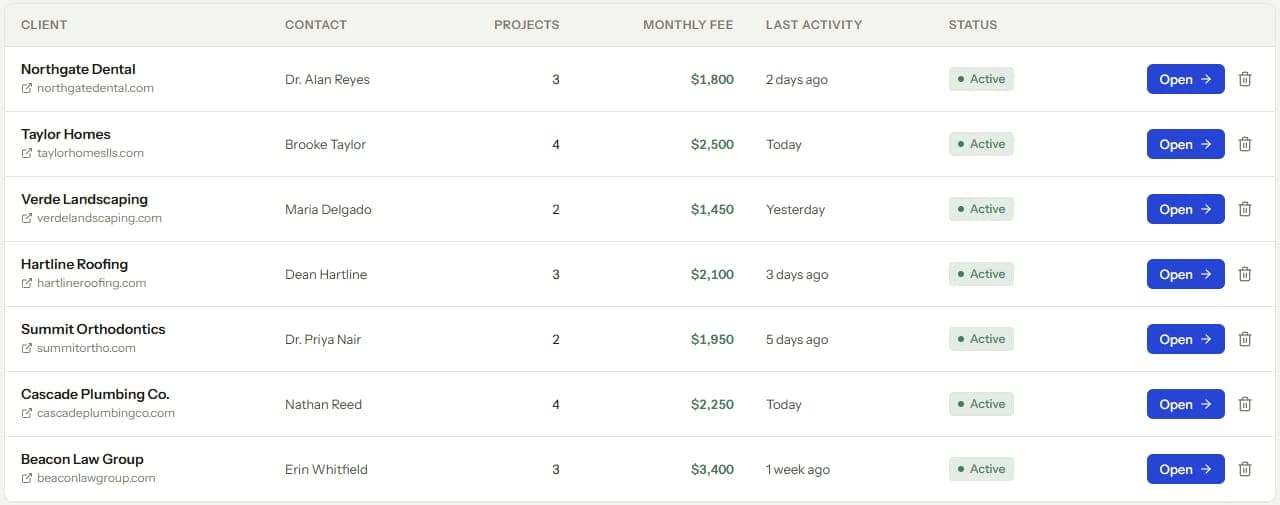
A causation report is cheap to produce only when the delivery system feeds it. This is the reporting layer of the multi-client operations playbook, and it depends on the other motions doing their jobs.
The audit cadence supplies the fixes shipped and the next-up queue, straight from the triage matrix in our portfolio audit SOP. The testing cadence supplies measured deltas. The change log supplies section one, and revenue context recorded at onboarding turns click deltas into dollar estimates a business owner can act on.
Assembled this way, a monthly report takes under an hour per client. Assembled by hand from disconnected tools, the same report takes half a day and still argues from correlation. This is the workflow RankNest is built around, audits, link maps, tests, and the client workspace feeding one narrative, though the structure works with whatever tools you run.
Reporting quality is downstream of delivery structure, which is why fixing the report usually means fixing the system behind it.
Once the structure is in place, the natural next step is stacking real experimental evidence inside it. We cover that end of the argument in how to prove SEO ROI with experiments instead of dashboards.
FAQ
What should a monthly SEO report include?
Three sections, a dated log of changes made, outcomes paired to those changes, and next month's ranked priorities. Add one page of portfolio-level metrics for context. Every number in the outcomes section should trace to a specific dated change.
How do you prove SEO results to a client?
Log every change with a date, then report before-and-after deltas around each change, using GSC baselines where possible. Annotate confounds like seasonality and algorithm updates honestly. Attribution built from dated changes is what separates proof from a rising graph that might have risen anyway.
How long should an SEO client report be?
Five to eight pages covers the three-part structure for most SMB retainers. Length usually signals padding, since ranking tables expand to fill any page count. A short report where every line traces to a change beats a long one that summarizes weather.
What metrics matter most in SEO client reporting?
Clicks and conversions on the pages you worked on, measured before and after the work, matter most. Portfolio-wide clicks, impressions, and revenue estimates provide context. Rankings are an intermediate signal and belong in an appendix at most.
Why do clients cancel SEO retainers even when traffic is growing?
Because growth without attribution earns the agency no credit, the client suspects the trend would have happened anyway. Cancellation calls cite budget, but budget is the polite word for invisible work. Reporting that ties changes to outcomes makes the agency's contribution legible enough to defend the line item.