Internal link structure audits identify orphaned pages, broken links, poor anchor text distribution, and excessive crawl depth that harm search rankings. A comprehensive internal linking audit involves crawling your site, analyzing link equity distribution, identifying issues by priority, and implementing strategic improvements. Most sites have 15-30% of pages with internal linking issues negatively impacting organic visibility. If you're comparing tools for this work, our guide to Link Whisper alternatives for agencies and multi-site SEOs breaks down the options that handle multi-site audits better than a single-site plugin.
New to the underlying strategy? Start with our complete guide to internal linking strategy before diving into the audit steps below.

Why Internal Link Audits Drive Client Results and Agency Revenue
Internal link structure audits deliver measurable business impact while creating recurring revenue opportunities. Sites with optimized internal linking see 40-300% traffic increases according to Ahrefs' analysis of 190,000 websites.
The Business Case for Traffic, Rankings, and Revenue Impact
Average B2B sites have 23% of pages orphaned or poorly connected, representing substantial lost revenue potential. When e-commerce sites fix internal linking issues, product pages previously generating zero organic traffic begin capturing search visibility within 45-60 days. Running a large catalog? See our guide to internal linking for massive e-commerce sites for enterprise-scale specifics.
For agencies, internal link audits take 3-8 hours but deliver 6-12 months of traffic growth. This creates an ideal foundation for quarterly maintenance packages that generate recurring revenue while demonstrating ongoing value.
How Link Equity Distributes Through Your Site
Page authority flows following Google's reasonable surfer model, where link position, context, and surrounding content affect the weight passed. Links in main content areas pass more authority than footer links. Each internal link passes roughly 85% of the source page's authority after applying the damping factor. If you want a way to measure that flow in practice, our guide to A/B testing internal links shows how to set up a before-and-after experiment.
Strategic internal linking directs link equity to high-value pages: conversion-focused product pages, money pages, or content targeting competitive keywords. Without intentional structure, page authority accumulates on low-value pages like privacy policies while starving pages that drive business results.
Hub-and-spoke architecture maximizes link equity efficiency. Hub pages (pillar content or category pages) link to related spoke pages (supporting content or product pages), and spoke pages link back to their hub. This bidirectional flow creates topic cluster authority that search engines recognize and reward.
The Hidden Cost of Poor Internal Linking
Beyond lost rankings, poor website crawlability creates operational inefficiencies. Content teams publish valuable pages that never get discovered. SEO teams waste hours identifying why pages won't rank, only to find they're buried at crawl depth 7.
Sites with strong internal linking require 40-60% less ongoing optimization because new content automatically integrates into existing topic clusters through standardized linking templates.
Crawl budget waste represents another hidden cost. When internal link structure forces crawlers to navigate through low-value pages to reach important content, crawl budget gets depleted on pages that don't drive results. Sites with efficient deep linking see 25-40% more frequent crawling of priority pages.
8 Critical Internal Linking Issues Costing Your Clients Rankings

Orphaned Pages: The Silent Traffic Killer
Problem: Pages with zero internal links pointing to them.
Why it happens: New pages get published without integration into existing site architecture. Content teams add blog posts, product pages, or resource guides but forget to connect them to related existing content.
Impact: Orphaned pages lose 80-100% of their ranking potential due to lack of link equity and crawl priority. Pages with even 1-2 internal links receive 300-500% more organic visibility than orphaned pages with equivalent content quality.

Broken Internal Links and Redirect Chains
Problem: Internal links pointing to 404 pages or through multiple 301 redirects.
Why it happens: Page deletions during site cleanups without updating internal references. URL structure changes during redesigns or migrations. CMS plugins or theme updates that change permalink structures without creating proper redirects.
Impact: Broken links to pages with existing backlinks waste referral equity. Each redirect in a chain leaks roughly 15% of PageRank, so a three-redirect chain loses nearly 40% of the original link value.

Poor Anchor Text Distribution
Problem: Generic anchor text ("click here," "read more") or keyword stuffing across internal links.
Why it happens: Automated CMS templates that generate default "Read More" buttons. Content writers unaware of SEO best practices. Over-optimization from outdated tactics.
Impact: Search engines struggle to understand page topic relevance when anchor text provides no semantic context. Generic anchor text forces Google to rely solely on surrounding content to determine relevance, weakening topical authority signals. Exact-match anchor text repeated 50+ times triggers over-optimization filters that can suppress rankings.
Excessive Crawl Depth Burying Important Pages
Problem: High-value pages requiring 5+ clicks from homepage to access.
Why it happens: Poor navigation hierarchy with no hub-and-spoke structure connecting related content. Flat site structures where every page sits at the same level. Category structures that create unnecessary layers.
Impact: Pages beyond crawl depth 4 receive 90% less crawl frequency and link equity compared to pages at depth 2-3. E-commerce sites commonly bury product pages at depth 5-7, resulting in inventory that generates zero organic traffic despite having search demand.
Link Equity Waste Through Poor Site Architecture
Problem: Valuable link equity flowing to low-priority pages (tags, archives, author pages) instead of money pages.
Why it happens: Default CMS structures that automatically link everything to everything. Blog platforms that create tag pages, category pages, date archives, and author archives (all receiving internal links from every post).
Impact: High-converting pages receive insufficient page authority while utility pages accumulate authority they don't need. A site might have 1,000 product pages each receiving 3-5 internal links, while tag pages receive 200+ internal links simply because every tagged post links to them.
Navigational Link Over-Reliance
Problem: Pages receiving internal links only through site-wide navigation, with no contextual content links.
Why it happens: Site architecture depends entirely on header/footer navigation. Content creators don't add contextual links within article body content.
Impact: Navigation links carry less contextual relevance weight than in-content links. Google's reasonable surfer model assigns higher probability that users will click contextual links relevant to the content they're reading. Pages relying solely on navigation links receive 40-60% less link equity.
Reciprocal Linking Gaps Between Related Content
Problem: Related content pieces link in only one direction instead of bidirectionally connecting topic clusters.
Why it happens: Content published sequentially with new posts linking to older posts, but older posts never updated to link back. Siloed content teams where different writers don't coordinate internal linking strategies.
Impact: Topic cluster authority fails to accumulate because related content doesn't reinforce connections. When Page A links to Page B but Page B doesn't link back, the relationship signal weakens.
Deep Link Ratio Imbalances
Problem: Overwhelming percentage of internal links pointing to homepage or top-level pages, with deep content pages receiving minimal internal links.
Why it happens: Site-wide navigation creates hundreds of internal links to homepage from every page. Breadcrumb navigation generates repetitive top-level category links.
Impact: Link equity concentrates at site's top levels instead of distributing to deep content that targets long-tail keywords. Sites with 80%+ of internal links pointing to top 20 pages create artificial authority concentration that doesn't match user search behavior. If you need to review this kind of pattern across a client roster, our guide to how to audit internal links across 20 client sites without losing a week covers the cadence and triage process.
The Complete Internal Link Audit Methodology (8 Steps)
Step 1: Crawl Your Website and Collect Link Data
Configure your crawler to perform a comprehensive site architecture audit. For sites under 500 pages, use Screaming Frog's free version. For larger sites or multi-client efficiency, RankNest's Internal Link Mapping tool automates this process while visualizing results on an interactive canvas.
Crawl configuration settings for optimal analysis:
User agent: Mozilla/5.0 (compatible; Googlebot/2.1; +http://www.google.com/bot.html)
Respect robots.txt: Enabled
Follow internal links: Yes
Follow external links: No
Crawl speed: 2-5 URLs/second
Maximum crawl depth: Unlimited
Data to capture during your crawl:
All internal links with source URL and destination URL
Anchor text used for each link
HTTP status codes (200, 301, 302, 404, 410, 500, 503)
Crawl depth from homepage
Page titles and meta descriptions
Inbound/outbound internal link counts per page
Link position indicators (navigation, content, footer, sidebar)
For large sites (10,000+ pages), segment your crawl by subdirectory or content type.
Step 2: Identify and Prioritize Orphan Pages
Compare your site's crawlable pages against pages with inbound internal links. In Screaming Frog, filter the "Inlinks" column for pages with zero internal links. Cross-reference with Google Analytics to prioritize orphans that previously received organic traffic.
For detection methods and fix frameworks beyond this checklist, see our complete guide to fixing orphan pages.
Prioritization framework:
Priority | Criteria | Timeframe |
Critical | 100+ monthly sessions, 10+ referring domains, conversion pages | 48 hours |
High | 20-100 monthly sessions, 3-10 referring domains, hub/pillar content | 7 days |
Medium | 5-20 monthly sessions, 1-2 referring domains, supporting content | 30 days |
Low | Zero historical traffic, outdated content, thin pages | Quarterly |
RankNest's AI Linking Plan automatically detects orphan pages and recommends specific hub pages that should link to them, complete with suggested anchor text based on topical relevance analysis.
Step 3: Analyze Crawl Depth and Site Architecture
Important pages should be within 3 clicks from your homepage. Sort your crawl data by depth to identify critical pages buried too deep.
Crawl depth issues often trace back to the underlying architecture decision — see our comparison of SEO silo vs. flat architecture.
Crawl depth analysis process:
Export crawl data and add a "Page Priority" column based on business importance
Sort by crawl depth descending to surface the deepest pages first
Cross-reference with page priority (any Priority 1 pages at depth 4+ require immediate fixes)
Calculate average crawl depth by page type
Target crawl depth distribution:
Depth 1 (homepage): 1 page
Depth 2 (main categories, key landing pages): 5-15 pages
Depth 3 (subcategories, hub content, important products): 50-150 pages
Depth 4 (supporting content, secondary products): 300-800 pages
Depth 5+ (detailed content, long-tail pages): Less than 50% of site
If important pages sit at crawl depth 5+, restructure your internal linking architecture by creating strategic hub pages that connect related content and bring high-value pages closer to the homepage.
Step 4: Audit Anchor Text Distribution
Export all internal links with anchor text from your crawler. Look for patterns indicating missed opportunities or over-optimization.
For ratio frameworks and penalty-avoidance rules, see our anchor text best practices guide.
Analysis framework:
Create a pivot table categorizing anchor text types:
Exact match: Anchor text exactly matches target keyword
Partial match: Anchor text contains target keyword with additional words
Branded: Anchor text contains brand name
Generic: Non-descriptive text ("click here," "read more")
Image links: Links using <img> tags where alt text serves as anchor text
URL: Raw URL used as anchor text
Optimal distribution for target pages:
15-25% exact match keywords
40-50% partial match/semantic variations
20-30% branded
Remaining generic (acceptable only for navigational elements)
Problem patterns:
Over-optimization: Single page receiving 50+ internal links with 80%+ identical exact-match anchor text
Under-optimization: Important page receiving 100+ internal links but 90% use generic anchor text
Inconsistency: Related pages in same topic cluster using completely different anchor text strategies
Step 5: Find and Catalog Broken Internal Links
Filter your crawl report for 404 status codes, 301/302 redirects, and 5XX server errors. Sort by inbound link count to prioritize fixes that recover the most link equity.
Identification process:
Navigate to Response Codes > Client Error (4xx) to see all 404 pages
Export this report with "Inlinks" column showing how many pages link to each broken URL
Cross-reference with Ahrefs or Moz to check if broken URLs have external backlinks
Check Response Codes > Redirection (3xx) for redirect chains requiring consolidation
Priority levels:
Priority | Criteria | Timeframe |
Critical | 10+ internal links, has backlinks, money pages with errors | Immediate |
High | 5-10 internal links, unnecessary 301s, 302s in place 3+ months | 1 week |
Medium | 1-4 internal links, 2-redirect chains, footer/navigation breaks | 30 days |
Low | Zero internal links, historical redirects with no traffic | Quarterly |
Fix broken internal links on pages with existing backlinks first.
Step 6: Map Internal Link Equity Flow
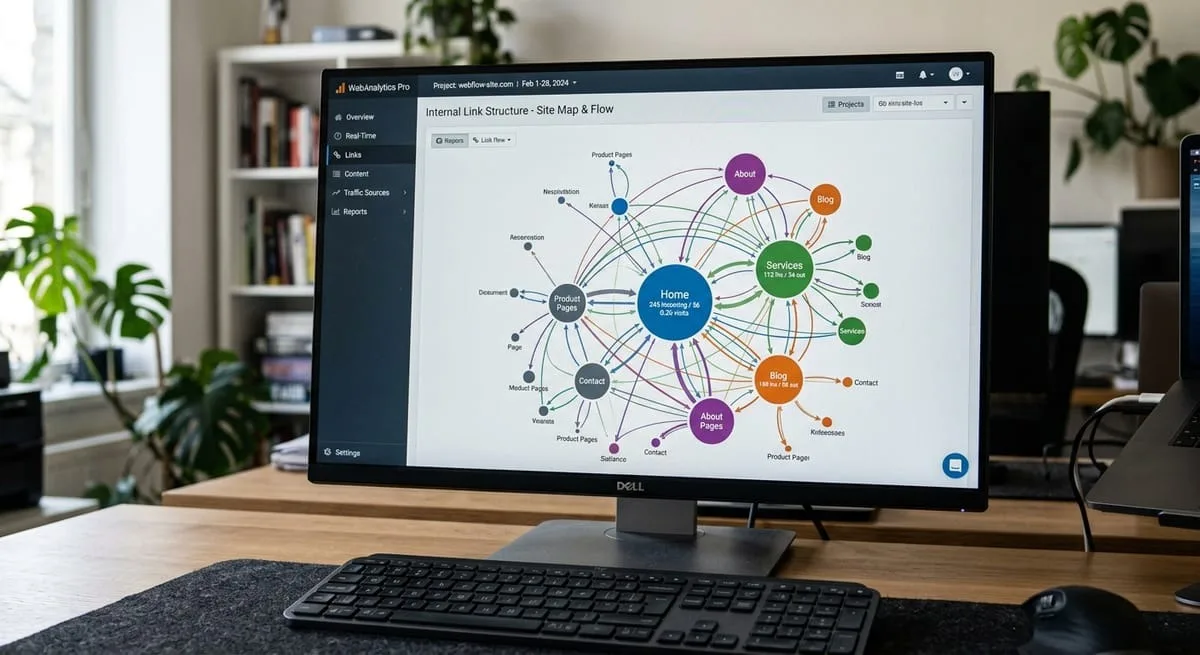
Visualize how page authority distributes across your site architecture. RankNest's visual link mapping platform shows this automatically with node sizing based on inbound link count and arrows showing link flow between pages.
For manual approach, create a link equity simulation:
Export all internal links with source URL, destination URL, and source page's inbound link count
Assign homepage a starting value of 100
Calculate each page's link equity as: (Sum of all source page values × 0.85) ÷ source page's total outbound links
Iterate this calculation 3-5 times to see how equity distributes
What to analyze:
Pages receiving disproportionate link equity that aren't conversion pages
Money pages receiving insufficient links (fewer than 5-10 internal links)
Topic cluster isolation (clusters not connecting to related clusters)
One-way link flows where reciprocal linking would make sense
Hub-and-spoke verification:
For each topic cluster:
Identify the hub page
Count how many spoke pages link back to the hub (target: 80%+)
Count how many hub pages link out to each spoke (target: 100%)
Verify bidirectional connection exists
Step 7: Document Strategic Linking Opportunities
Based on steps 2-6, create a prioritized list of internal linking changes. RankNest's platform automates this by analyzing your entire site architecture and recommending specific source pages, destination pages, and anchor text strategies.
Documentation structure:
Create a master linking opportunities spreadsheet with these columns:
Opportunity ID
Opportunity Type (orphan fix, crawl depth reduction, anchor text optimization)
Priority Level (critical/high/medium/low)
Source Page URL
Destination Page URL
Current Status
Recommended Anchor Text
Placement Context
Business Impact
Implementation Notes
Assigned To
Status (pending/in progress/complete)
Date Completed
Categories to document:
Critical (orphan pages with historical traffic): Add 3-5 contextual links within 48 hours
High (money pages below crawl depth 3): Add hub page connections within 1 week
Medium (poor anchor text): Update during regular content refreshes within 30 days
Low (reciprocal linking opportunities): Implement during quarterly content audits
Step 8: Create Your Prioritized Action Plan
Convert your documented opportunities into an executable workflow with clear ownership, deadlines, and success metrics.
Workflow phases:
Phase 1 (Week 1): Critical Fixes
All orphan pages with historical traffic
Broken internal links with external backlinks
Money pages buried at depth 5+
Goal: Recover 60-80% of lost traffic potential
Phase 2 (Weeks 2-4): High Priority Optimization
Remaining orphan pages without historical traffic
Anchor text optimization for top 20 ranking pages
Reciprocal linking between topic cluster pages
Goal: Establish topic cluster authority
Phase 3 (Months 2-3): Medium Priority Enhancement
Deep linking to increase crawl efficiency
Hub page creation where architecture gaps exist
Navigation hierarchy improvements
Goal: Comprehensive site architecture optimization
Phase 4 (Quarterly Ongoing): Maintenance
New content integration
Quarterly broken link reviews
Anchor text diversity maintenance
Link equity flow monitoring
Goal: Prevent regression
Team assignment matrix:
Content writers: Add contextual in-content links, update anchor text, write new connecting content
Technical SEO: Configure redirects, fix broken links, update XML sitemaps, monitor crawl depth
Project manager: Track implementation status, coordinate between teams, report progress
QA/testing: Verify links work correctly, spot-check anchor text implementation
After implementing changes, recrawl the site within 7-14 days to verify fixes. Compare before/after metrics:
Orphan page count (target: 0)
Average crawl depth (target: <3.5 for important pages)
Broken link count (target: <1% of total internal links)
Link equity concentration ratio (target: 20-30% in top 10 pages)
Pages with >5 internal links (target: 80%+ of published content)
Agency Workflow: Auditing Multiple Client Sites Efficiently
Internal link structure audits scale poorly without proper workflow systems. Here's how agencies complete audits across multiple clients without burning billable hours. The wider operating model around this work is in our playbook on scaling SEO across multiple clients.
Time Benchmarks by Site Complexity
Site Size | Total Time | Breakdown |
Small (≤500 pages) | 2-3 hours | 30min crawl + 60min analysis + 45min report |
Medium (500-5,000 pages) | 4-8 hours | 90min crawl + 3-4hr analysis + 90min report |
Large (5,000+ pages) | 12-20 hours | 3hr crawl + 8-12hr analysis + 4hr report |
Time-saving automation:
Crawl templates: Reduce setup from 30 minutes to 5 minutes
Excel analysis templates: Reduce processing from 2 hours to 20 minutes
AI-powered recommendations (RankNest): Eliminate 3-4 hours of manual planning
Standardized reports: Reduce deliverable creation from 90 minutes to 15 minutes
Batch Processing Techniques for Multiple Clients
Configure crawl templates once, deploy across 10 clients in 30 minutes. Save Screaming Frog configurations or use RankNest's multi-client dashboard to queue crawls overnight.
Crawl template standardization:
Create 3 saved configurations:
Small Site Template (under 1,000 pages): Full crawl, all data extraction, 5 URLs/second
Medium Site Template (1,000-10,000 pages): Segmented crawl with custom filters, 3 URLs/second
Large Site Template (10,000+ pages): Targeted crawl focusing on money pages and main navigation, 2 URLs/second
Parallel analysis workflow:
Instead of completing one client audit start-to-finish, batch similar tasks:
9:00-10:30am: Review all overnight crawl data, export necessary reports
10:30-12:00pm: Identify orphan pages across all client sites
1:00-2:30pm: Analyze crawl depth distribution for all clients
2:30-4:00pm: Document top priority opportunities
4:00-5:00pm: Create executive summaries
This batching approach reduces context-switching time by 30-40% compared to completing single audits sequentially.
Team Task Delegation Matrix
Role | Responsibilities | Hours per Site |
Junior | Run crawls, export data, catalog broken links, create orphan page lists | 1-1.5 (small), 2-3 (medium) |
Mid-level | Analyze crawl depth, audit anchor text, create prioritized recommendations | 2-3 (small), 4-6 (medium) |
Senior | Review recommendations, adjust priorities, create client presentations | 1 (small), 2 (medium) |
This delegation structure allows a 3-person team to audit 10 client sites simultaneously in the same time previously required for 2-3 sites.
Internal Link Audit Tools Comparison
Choosing the right audit tool depends on site size limitations, budget constraints, and reporting requirements. We compare the current options in our review of the best internal linking tools for agencies.
Free vs. Paid Tools ROI Analysis
Free tier limitations: Screaming Frog's free version caps at 500 URLs, viable only for small business sites. Google Search Console provides internal link data but lacks crawl depth analysis and anchor text extraction capabilities. For how this slot fits the rest of an agency stack, see our workflow-organized breakdown of the best SEO tools for agencies.
Free tools require 2-3x more time investment because they lack automated reporting, bulk data exports, and advanced filtering.
Paid tool ROI calculation:
A Screaming Frog license processes unlimited URLs. Time savings: 2 hours per audit × 20 client audits/year = 40 hours saved = significant recovered billable time at standard agency rates.
RankNest's pricing automates link mapping, AI-powered recommendations, and multi-client management (reducing audit time by 40% while adding visual deliverables). For agencies auditing 5+ clients monthly, paid tools pay for themselves through time savings within the first month.
Tool-by-Tool Feature Breakdown
Tool | Best For | Link Analysis | Visual Mapping | AI Recommendations | Multi-Client |
Screaming Frog | Granular desktop control | Excellent | Manual | No | No |
RankNest | Agency workflows | Excellent | Automated | Yes | Yes |
Ahrefs Site Audit | Existing Ahrefs users | Good | Limited | No | Yes |
Sitebulb | Team collaboration | Excellent | Good | Limited | Yes |
Google Search Console | Free validation | Limited | No | No | 1000 properties |
Screaming Frog SEO Spider:
Strengths: Best crawl customization and data extraction flexibility. Handles JavaScript rendering. Custom extraction via XPath and RegEx.
Limitations: No visual representation of page authority flow. Desktop-only application.
Best for: Technical SEO specialists who need granular control.
RankNest Internal Link Mapping Platform:
Strengths: Built specifically for agencies managing multiple client site audits. Crawls automatically, draws every page as a node on an interactive canvas, organizes pages into topic clusters, and generates AI-powered linking recommendations.
Limitations: Focuses specifically on internal linking and site architecture.
Best for: Agencies prioritizing efficiency and client communication.
Creating Client-Ready Audit Reports
Technical audit data means nothing if clients can't understand it.
Executive Summary Framework for Non-Technical Clients
Structure every audit report with:
1. Problem statement (2-3 sentences):
"Your site has 143 pages with zero internal links, representing 31% of published content receiving no link equity. These orphaned pages and 67 broken internal links prevent Google from efficiently crawling your site and distributing page authority to important pages." For agencies considering tools for this work, our RankNest vs. Link Whisper comparison explains how a single-site WordPress plugin differs from mapping and measuring links across client sites on any CMS.
2. Business impact (specific numbers):
"These orphaned pages previously generated organic sessions based on Google Analytics historical data. This represents lost revenue opportunity at your average conversion rate."
3. Solution overview:
"We'll implement strategic internal links over the next 30 days, connecting orphaned content to existing hub pages and fixing broken links that waste external referral authority."
4. Expected outcomes (quantified predictions):
"Based on implementations for similar B2B sites, we expect traffic increases to previously orphaned pages within 45-60 days, and overall organic traffic growth within 90 days."
5. Timeline (visual milestone chart):
Phase 1 (Critical fixes): 7 days
Phase 2 (High-priority): 21 days
Phase 3 (Optimization): 60 days
Format considerations:
Maximum 1 page for executive summary
Use 14-16pt font for readability
Bold problem statement, business impact, and expected outcomes
Include one visual element (chart showing current vs. projected traffic)
Avoid SEO jargon completely
Visual Report Components That Win Client Buy-In
Before/after site architecture diagrams:
Show current link structure with orphaned pages highlighted in red, then show proposed structure with new connections in green. RankNest's visual link mapping platform exports these automatically as high-resolution images.
Crawl depth comparison charts:
Bar chart showing page distribution by crawl depth before optimization vs. after.
Priority matrix:
2x2 grid plotting internal linking opportunities by "Business Impact" vs. "Implementation Effort". Quick Wins quadrant should contain 40-50% of opportunities.
Implementation roadmap:
Gantt chart showing phased rollout over 90 days with milestone checkpoints.
Technical issue severity breakdown:
Donut chart showing percentage of issues by severity level. Critical (red, 18%), High (orange, 34%), Medium (yellow, 32%), Low (green, 16%).
Ready to audit your internal links in minutes instead of hours? RankNest's Internal Link Mapping solution crawls your site, visualizes your architecture on an interactive canvas, and generates AI-powered linking recommendations automatically. Start your free trial and see your complete link structure in 15 minutes.