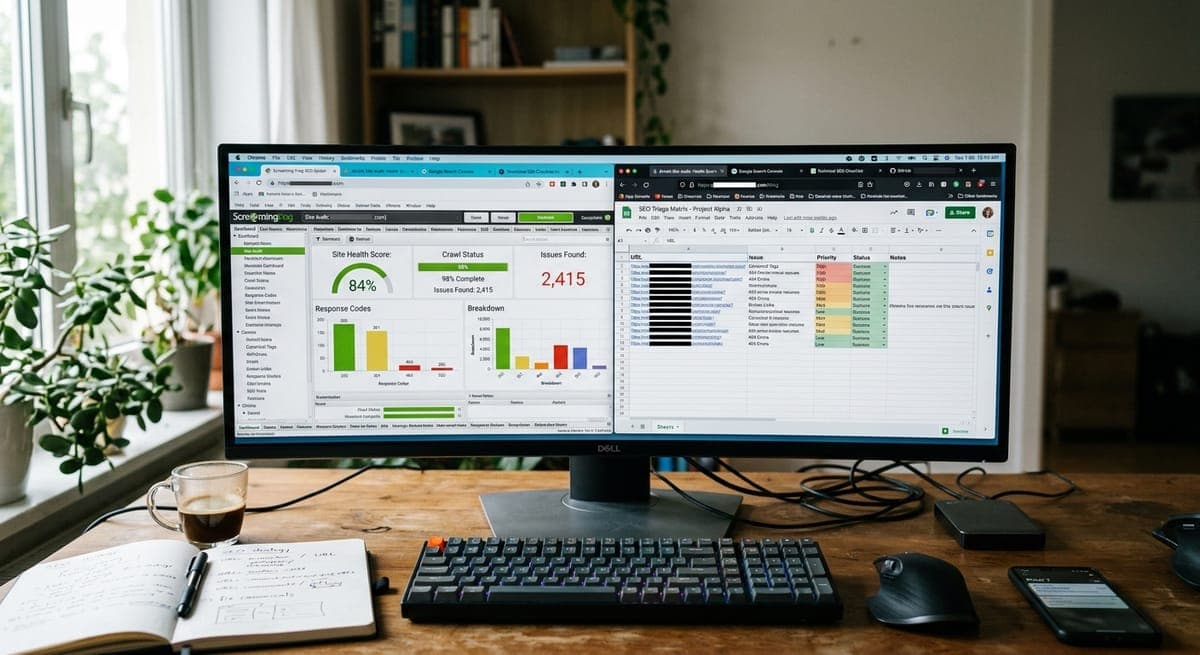
An SEO client dashboard is one screen per client that shows search performance, the work in progress, and what changed since the last report. The shortest path for most agencies is AgencyAnalytics at $20 per client per month, which includes a white-labelled portal the client logs into. Databox, DashThis and Whatagraph solve the same problem at different prices, Looker Studio does it free if you are willing to build it, and RankNest, which we make, works the other way round: a per-client workspace where the Search Console data and the SEO work sit together, with no client login at all.
That split decides most of this list, so it is worth settling before you compare prices. Reporting tools pull numbers out of other tools and present them. Work tools hold the numbers and the work in the same place. Agencies usually need both, and the expensive mistake is buying one expecting it to behave like the other. All prices below were checked on the vendors' own pricing pages on 18 September 2026.
What an SEO client dashboard is
A client dashboard is a single view of one client's search performance, assembled from sources the client cannot easily read themselves. At minimum that means Google Search Console, usually Google Analytics, often Google Business Profile, and sometimes rank tracking and call tracking on top.
Two things separate it from a report. A report is a document you send. A dashboard is a live surface somebody can open, which means it has to stay correct without you touching it. And a client dashboard is scoped to one client, which sounds obvious until you have eleven of them and every screen is a different shape.
The reason agencies buy one is rarely the data. Search Console is free and the client could log into it. What they are buying is the removal of four hours a month of copying numbers into slides, plus a surface the client can open at 9pm the night before a board meeting without emailing anyone. Whether that surface should be client-facing at all is a real question, and the answer is not always yes. That is covered further down.
The six options, side by side
| Tool | Entry price | Client login | Best for |
|---|---|---|---|
| AgencyAnalytics | $20 per client / month, billed annually | Yes, white-labelled | Agencies that want client reporting solved and nothing else |
| Databox | Agency from $99 / month | Yes, white-label is an $80 / month add-on | Reporting that has to reach past marketing data |
| DashThis | $54 / month, or $44 paid yearly | Shareable dashboards | Small rosters that want reports without a platform |
| Whatagraph | From €699 / month, billed annually | Yes, white-label reports | In-house teams and larger agencies with a reporting budget |
| Looker Studio | Free | Share a link | Anyone with time and a tolerance for maintenance |
| RankNest | $50 / month, 1 client | No | Agencies who want the work and the data in one place |
1. AgencyAnalytics, the default for client reporting
AgencyAnalytics charges $20 per client per month billed annually, with every feature unlocked at that price. There is no tier to climb. Each client gets unlimited data sources, unlimited reports and dashboards, and unlimited staff and client users, drawing on more than 85 integrations. White-label branding, a client portal, a custom domain and email, API access, goals and anomaly detection are included rather than gated. Agencies past 25 clients move to a custom plan.
If the job you are hiring for is a branded dashboard your clients can log into, this is the answer, and it is the cheapest answer at small rosters. One client costs $20 a month. Three clients cost $60. Nothing else on this list is close at that size.
The catch for SEO specifically is that rank tracking is a paid add-on at $41.67 a month per 500 keywords billed annually, and the AI visibility tracker is another $20.83 a month per 250 credits. A five-client SEO agency tracking a hundred keywords each will pay the add-on, so budget the real number rather than the headline one.
The other limit is structural and applies to every reporting tool here. AgencyAnalytics shows you what happened. It does not hold the record of what you changed, so it cannot tell you which of your changes caused it. That distinction is the whole argument in reporting that shows causation rather than correlation.
2. Databox, when the numbers come from outside marketing
Databox starts free for one user, three data sources and one dashboard, which is enough to decide whether you like it. The agency plan starts at $99 a month with unlimited users, 20 data sources and 300 AI credits, and you add capacity in client packs at $25 a month for one client and five more sources. White-labelling is a separate $80 a month add-on, which matters if a branded client view is the reason you are shopping.
Databox earns its place when the dashboard has to reach past marketing tools into a CRM, a billing system or a warehouse. If the client's question is whether SEO produced revenue, and revenue lives in HubSpot or Stripe rather than in Analytics, this is the tool that can answer without a spreadsheet in the middle.
For a straightforward SEO retainer it is more machinery than the job needs, and at five clients the packs plus white-labelling put it above AgencyAnalytics for a narrower result.
3. DashThis, one dashboard is one report
DashThis prices by dashboards and data sources rather than by client. Individual is $54 a month, or $44 paid yearly, for three dashboards and 15 sources. Professional is $164 a month, or $139 paid yearly, for ten dashboards and 40 sources. A dashboard here means one marketing report, which can hold every platform you connect to it.
The appeal is that it is a report builder and stops there. Setup is quick, the templates are usable on day one, and nobody has to learn a platform. For a freelancer with three clients who wants the monthly report to build itself, $44 a month is a fair trade.
Watch the unit. Three dashboards is three clients only if one report per client is genuinely enough, and it stops being enough the first time a client asks for a separate view of local performance.
4. Whatagraph, for teams with a reporting budget
Whatagraph lists two plans, both billed annually. Max starts at €699 a month and includes advanced integrations, data groups and blends, white-label reports, KPI overviews with alerts and a dedicated success manager. Prime is priced on request and adds transfer to BigQuery and Looker.
At that price it is aimed at reporting teams rather than at individual SEO retainers, and the pitch is scaling reporting without adding headcount. If you are a five-person agency comparing it against $20 per client, the maths will not work. If reporting is already costing you a salary, it might.
5. Looker Studio, free if you build it
Looker Studio is free, connects to Search Console and Analytics natively, and will produce a genuinely good client dashboard. Plenty of agencies run entirely on it. The honest version of the trade is that you pay in maintenance instead of licence fees.
Budget six to ten hours to build a template you are happy with. After that each new client is perhaps thirty minutes of connector wiring, which is cheap. The recurring cost is everything else: connectors that quietly stop refreshing, a client who renames a GA4 property, date ranges that drift, and the fact that the person who built it is the only one who can fix it.
Looker Studio is the right answer at one to three clients, and at ten it is usually a part-time job nobody has scheduled. The switch tends to happen the month a dashboard breaks on the morning a report is due.
It also inherits the same blind spot as the paid tools. It shows the line moving. It holds no record of what you changed, so the story still has to come out of your own notes.
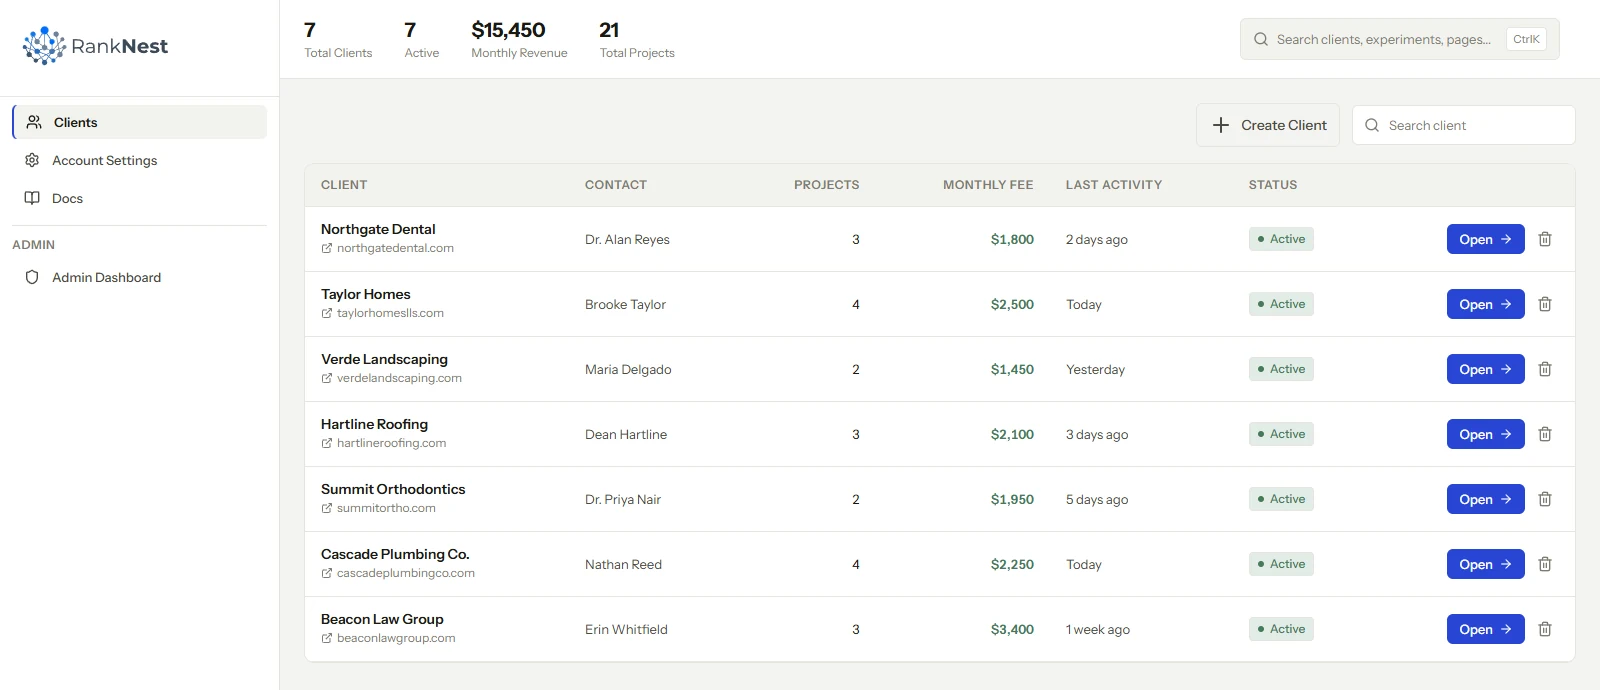
6. RankNest, when the dashboard should hold the work too
We build RankNest, so read this section with that in mind. It is not a client-facing dashboard and it does not try to be. There is no client login and no white-label option. What it gives you is a workspace per client where the Search Console property, the Business Profile, the audits, the link maps and the tasks sit behind one screen, so an account is readable without six Google logins. If you also need to queue posts, the Google Business Profile post scheduler lets you schedule and publish Google Business Profile posts and photos, with images and CTAs, from the same dashboard.
The reason it exists is the gap every tool above shares. A reporting dashboard can tell a client that clicks rose 14 percent. It cannot tell them which change did it, because it never recorded that a change was made. RankNest keeps the test log next to the numbers, so a month of work reads as a list of dated changes with measured outcomes instead of a trend line and a paragraph of explanation. That is the same argument as proving SEO ROI with experiments rather than dashboards.
Pricing is $50 a month for one client, $150 for five and $500 for ten, with all six tools on every plan and a 14-day free trial that does not ask for a card. Current limits are on the pricing page.
Where AgencyAnalytics is the better buy: if what you need is a branded dashboard your client opens themselves, buy AgencyAnalytics, and at one to five clients it will also cost you less. Some agencies run both, one for the client-facing report and one for the work. That is a real answer rather than a hedge.
What clients actually want to see in a portal
Most client portals fail the same way. They show everything the tool can export, which is a lot, and the client reads none of it. The agency then concludes that clients do not care about reporting, when what happened is that nobody could find the answer to their question.
Clients open a portal to answer three questions, in this order.
- Is it working? One number against the same month last year, and a plain sentence saying whether that is good. Not a chart with five lines on it.
- What did you do? A dated list of changes shipped since the last report. This is the section clients say they want and almost no dashboard produces, because reporting tools read data and do not record work.
- What happens next? Three or four items with dates attached.
Revenue belongs at the top whenever you can get it. Clicks are a proxy and everyone in the room knows it. If the client closes one in ten leads at $3,000, then forty extra monthly clicks converting at five percent is two leads and roughly $600 a month, and that sentence does more than any ranking chart.
Leave the vanity metrics out. Impressions in particular are worth watching internally and dangerous on a client screen, because impressions can rise for reasons that never send a visit. That is not hypothetical. A rising impression count against flat clicks is one of the most common shapes in Search Console right now.
One more thing worth deciding early: whether the client should have a login at all. A portal a client checks weekly generates questions on their schedule rather than yours. A monthly report generates the same questions once, in a call, where you can answer them properly. Plenty of agencies do better work without the live login, and that decision belongs in the onboarding SOP rather than in month four.
Running more than one client
Every tool here works for one client. The differences show up somewhere between five and fifteen, and they are mostly about what happens per client rather than what the dashboard looks like.
Three questions predict the pain. How long does adding a client take, counting the Google account connections and not just the template copy. What happens when a data source stops refreshing, and whether anyone finds out before the client does. And whether the pricing unit matches your growth unit, because a tool priced in dashboards or data sources will surprise you the first time one client needs three views. For the shopping phase, the review mining tool pulls Google Maps and Reddit reviews into themes, pain points and objections you can write copy from.
The wider stack question, meaning research, crawling, rank tracking and the rest, is a separate decision from the dashboard, and we covered it in the agency SEO stack. The operational half, keeping the roster readable as it grows, is in running SEO across multiple clients.
How to choose
Answer one question first. Does the client need to log in?
If yes, buy AgencyAnalytics at $20 per client and stop shopping, unless your data lives outside marketing tools, in which case look at Databox. If your roster is three or fewer and the budget is zero, Looker Studio will do it for the price of a weekend.
If no, and the real problem is that the client's work and the client's numbers live in different places, then a reporting tool will not fix it whichever one you buy, because none of them record what you changed. That is the gap RankNest is built for, and it is the one claim on this page worth testing yourself rather than taking our word on.
FAQ
What is an SEO client dashboard?
A single live view of one client's search performance, pulled together from sources the client cannot easily read on their own. That usually means Google Search Console and Analytics, often Google Business Profile, and sometimes rank tracking. It differs from a report in two ways: it stays current without you rebuilding it, and it is scoped to one client rather than to your whole roster.
What is the best SEO client dashboard for a small agency?
AgencyAnalytics at $20 per client per month billed annually, if the client needs a branded login. Every feature is unlocked at that price, including the client portal and white-label branding, so three clients costs $60 a month. Budget the rank tracking add-on separately at $41.67 a month per 500 keywords, because SEO agencies almost always need it.
Is there a free SEO client dashboard?
Looker Studio is free and connects to Search Console and Analytics natively. Expect six to ten hours to build a template you are happy with, then about thirty minutes per new client. The cost is maintenance rather than licence fees: connectors stop refreshing, properties get renamed, and whoever built it is usually the only person who can fix it.
What is the difference between an SEO client dashboard and an SEO client portal?
In practice the words are used interchangeably. Where people do separate them, a dashboard is the data view and a portal is the logged-in space around it, which may also hold documents, approvals and messages. The decision that actually matters is not the label but whether the client gets a login at all, because a live login generates questions on the client's schedule instead of yours.
What should an SEO client dashboard show?
Three things, in order. Whether it is working, as one number against the same month last year with a plain sentence saying whether that is good. What you did, as a dated list of changes shipped since the last report. And what happens next, as three or four items with dates. Put revenue at the top when you can get it, and keep impressions off the client screen, since impressions rise for reasons that never send a visit.
Can a client dashboard prove SEO is working?
Not on its own. Reporting tools read data from other tools, so they can show that clicks rose and cannot show which change caused it. Proving causation needs a record of what you changed and when, compared against the page's own baseline and the site-wide trend. That record has to come from somewhere other than the dashboard, whether that is a disciplined spreadsheet or a tool that keeps the test log beside the numbers.